
Impacts of climate-related risks and opportunities

Climate-related risks and opportunities that have the potential to impact our company are integrated into and addressed through key processes including: business and operational planning, strategic planning and financial planning. Our SD risk management process, risk register and Climate Change Action Plan identify those risks and assess the potential size, scope and prioritization of each.
We have aligned a description of these impacts with the categories included in the International Sustainability Standards Board (ISSB) International Financial Reporting Standard (IFRS) S2: Climate-related Disclosures.
Business model and value chain
Climate-related risks and opportunities may affect our business planning through impacts to demand for our product, product costs, supply chain, daily operating and mitigation activities, project design and emissions reduction projects, among others.
Products
Compliance with policy changes that create a carbon tax, fee, emissions trading scheme or greenhouse gas (GHG) reductions could significantly increase product costs for consumers and reduce demand for natural gas and oil-derived products. Demand could also be eroded by conservation plans and efforts undertaken in response to global climate-related risk. Many governments also provide, or may in the future provide, tax advantages and other subsidies to support the use and development of alternative energy technologies that could impact demand for our products. However, there are also opportunities associated with increased demand for lower carbon energy sources such as LNG to displace coal in power generation. Read more in the Business opportunities section.
Supply chain
We collaborate and innovate with industry groups, peers and suppliers to integrate sustainability into our supply chain strategies.
We engage with suppliers about the environmental and social aspects of their operations throughout the procurement process. This includes communicating our expectations and priorities and identifying opportunities for improvement and collaboration related to climate issues, including GHG management and environmental supply chain risks.
Supplier Scope 1 and Scope 2 emissions are a category of Scope 3 emissions.
In 2025, we continued our Supplier Emissions Strategy1 which is intended to help us effectively manage climate-related risks and influence opportunities within our value chain. Our strategy focuses on:
- Identifying suppliers with high relative impact on our Scope 3 emissions.
- Enhancing a governance framework for supplier sustainability to include supplier emissions.
- Annually reviewing our Supplier Expectations and updating when applicable to add to expectations associated with climate, nature, responsible use of resources and human rights.
- Collaborating with suppliers in conjunction with industry partners like Ipieca to align on disclosure frameworks and systems for collecting and reporting supplier emissions.
We continue to monitor climate-related risks and actively collaborate with suppliers with the ultimate aim of addressing and reducing emissions across the supply chain. Read more about our supply chain sustainability efforts.
Commercial
Our Commercial organization supports ConocoPhillips sustainability initiatives by supporting emissions reduction and other environmental initiatives, engaging with commercial partners to understand opportunities to reduce GHG emissions along the value chain, and managing market-facing opportunities in LNG that link our climate-related risk strategy to evolving global demand.
Near-term initiatives include:
- Evaluating the potential to deliver differentiated oil and gas products. This includes:
-
- Focusing on methane emissions reduction, measurement and verification to support regulatory requirements along the natural gas value chain.
-
- Engaging key certifiers to understand gaps between company plans and evolving certification requirements.
-
- Evaluating participation in the differentiated gas market.
Strategy and decision making
Resilient portfolio
Our ability to address climate-related risks and meet future energy demand will depend on our ability to deliver competitive returns on and of capital. Our sector-leading approach focuses on the cost of supply of our portfolio, committing to balance sheet strength and holding to disciplined reinvestment rates, and consistently delivering on our cash flow-based return of capital framework.
Oil and natural gas are projected to remain essential parts of the energy supply mix in coming decades across a broad range of future demand scenarios. We intend to maintain our key market role through remaining competitive and resilient to transition-related risks in any scenario by providing low-cost, low-GHG intensity production by asset type with continuously improving sustainability performance.
Portfolio diversification
The mix and location of the resources in our portfolio provide flexibility and adaptability as we monitor scenarios and global trends. Our short-cycle shale project times and capital flexibility enable us to redirect capital to the most competitive basins. Our portfolio is intentionally built with resilience, our Lower 48 assets provide short cycle flexibility, while our Alaska and International assets provide diversification, long-life profiles with advantaged decline rates., both of which play an essential role in meeting the world’s future energy demand.
Cost of supply and capital allocation
The cost of supply of our resource base is important because we believe that resources with the lowest cost of supply are most likely to be developed in scenarios with lower demand.
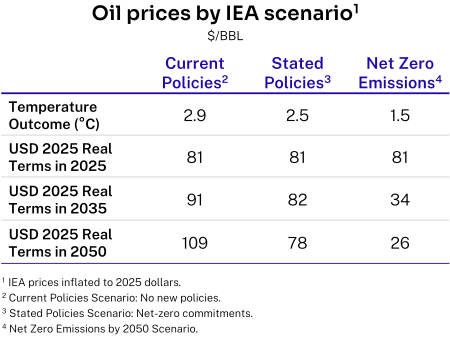
Cost of supply is the West Texas Intermediate (WTI) equivalent price that would generate a 10% after-tax return on a point-forward and fully burdened basis. In our definition, cost of supply is fully burdened with capital investment, foreign exchange, price-related inflation, general and administrative expenses, and carbon tax (if currently assessed). If no carbon tax exists for the asset, carbon pricing aligned with internal energy scenarios is applied. Cost of supply is the primary metric that we use for capital allocation and it has the advantage of being independent of price forecasts. Providing low cost of supply also addresses a key component of supporting future energy demand — reliable and affordable energy supply.
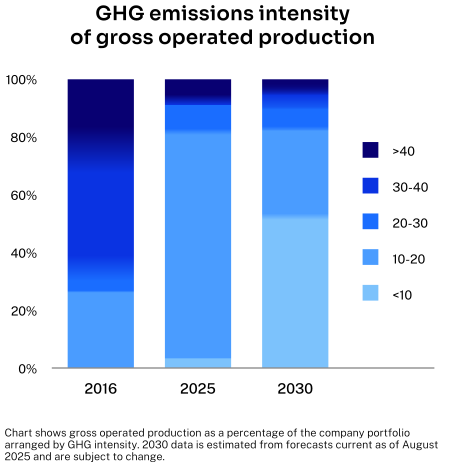 To assist our capital allocation decisions, we test our current portfolio of assets and investment opportunities against future possibilities and identify strengths and weaknesses that may exist.
In recent years we have high-graded our portfolio and applied stringent capital allocation criteria that direct investments to resources that will best match future energy demand. We are equally focused on developing assets that have a low cost of supply and low GHG intensity, as these are most likely to compete. Based on our current forecasts, assets with less than 10 kg CO2e/BOE are projected to represent a larger portion of our portfolio by 2030. In addition, the cost of supply of our portfolio performs competitively against expected commodity prices across a range of future scenarios.
Carbon price
We use assumptions of carbon pricing to navigate GHG regulations, encourage emissions reduction projects and energy efficiency, and stress test investments. In 2025, the company used a range of estimated future costs of GHG emissions for internal planning purposes, including an estimate of $60 per tonne CO2e as a sensitivity to evaluate certain future projects and opportunities. The base case for project approval economics and planning includes either the forecast of existing carbon pricing regulations or our current probability-weighted energy transition scenario for that jurisdiction, depending on which is higher. Where there is no carbon price regulation, we use the current transition scenario for that jurisdiction. We also run two sensitivities:
- With only existing carbon pricing regulations, to reflect near-term cash more accurately.
- With a sensitivity of $60 per tonne CO2e to act as a stress test to reduce the risk of stranded assets should climate regulation accelerate.
This ensures that both existing and emerging regulatory requirements are considered in our planning and decision making.
Cost of compliance with carbon legislation
| Climate Legislation | 2025 Actuals, net share before tax ($USD approx) | Operations Subject to Legislation | Percent of 2025 Production1 |
|---|---|---|---|
| Emissions trading schemes | |||
| European Emissions Trading Scheme (EU ETS) | $21 million | Norway | 5% |
| U.K. Emissions Trading Scheme (U.K. ETS) | $2.2 million | U.K. | 0% |
| Carbon fees and taxes | |||
| Norwegian Carbon Fee | $42 million | Norway | 5% |
| British Columbia and Alberta Carbon Tax | $0.01 million | Canada | 7% |
| GHG regulations for emissions reductions | |||
| Alberta Technology Innovation and Emissions Reduction (TIER) | N/A | Canada | 6% |
| British Columbia Output Based Pricing System (BC OBPS) | $12.3 million | Canada | 2% |
1.2025 country production over total production; cost of GHG emissions may only apply to some of our assets or to a particular portion of our emissions over a set baseline.
In addition to the use of carbon pricing in planning and project economics, we use it in impairment testing, cost of supply calculations, and reserve calculations.
- Impairment testing: BU LRP submissions are the basis for the assumptions used in our impairment testing model for both operated and non-operated assets aligned with the higher of existing regulations or the carbon pricing assumptions used in the current energy scenario.
- Cost of supply: On appraised resource volumes in our cost of supply model and LRP, we assume the higher of the carbon prices from existing regulations or those implied by the current scenario where applicable.
- Reserve calculations: In accordance with SEC guidelines, the company does not use an estimated market cost of GHG emissions when assessing reserves in jurisdictions without existing GHG regulations. In jurisdictions where GHG regulations exist we base carbon prices on market actuals. In cases where existing carbon prices are not based on the market but are preset by a regulatory body, we use the prepublished prices (e.g., Alberta).
Research and development
Technology will play a major role in addressing GHG emissions, whether through reducing emissions or lowering the energy intensity of our operations or value chain. As discussed in our Collaboration and engagement section, we participate in a number of research and industry initiatives, including the MIT Energy Initiative (MITEI) and Idaho National Labs (INL). The MITEI serves as MIT’s energy research, education and outreach organization, with activities focused on zero- and low-carbon energy systems. Our participation supports information sharing and collaboration on relevant research topics. In late 2025, ConocoPhillips was selected by INL to participate in micro reactor nuclear testing.
In 2021, ConocoPhillips joined the Pathways Alliance Inc., now called the Oil Sands Alliance, which represents five of Canada’s largest oil sands producers. Its other members are Canadian Natural Resources, Cenovus Energy, Imperial Oil Limited and Suncor Energy. The ambition of the alliance is to progress toward reducing Scope 1 and Scope 2 GHG emissions from oil sands operations to help Canada meet its climate goals with the use of carbon capture, transportation and storage. ConocoPhillips is partnering with the members of the Alliance and governments to accelerate emissions reduction efforts. Financial support, regulatory approvals and advances in technology are critical to advancing this ambition.
Another way we support technology development is through our annual marginal abatement cost curve (MACC) process which identifies and prioritizes our emissions reduction opportunities from operations based on the project’s breakeven cost of carbon ($ per tonne CO2e reduced). This data helps identify projects that might become viable in the future through further research, development and deployment. Our MACC process continues to guide a focus on near-term, executable opportunities that reduce costs and emissions, while also identifying technology focus areas, such as micro modular reactor (MMR)/small modular reactor (SMR), carbon capture and sequestration (CCS), and long-duration energy storage (LDES), for targeted engagement to inform risk and cost trajectories.
Financial planning
We take climate-related issues into account in our financial planning in several ways. We focus on the fundamental characteristics that drive competitive advantage in a commodity business — a low break-even price, low cost of supply and low capital intensity that drive free cash flow, capital flexibility and a strong balance sheet.
Commodity prices
In the short-to-medium term, we use a range of commodity prices derived from our scenario work. In the longer term our scenarios provide insight into the possibilities for future supply, demand and price of key commodities. This helps us understand a range of risks around commodity prices, and the potential price risk associated with various GHG reduction scenarios. History has shown an interdependency between commodity prices and operating and capital costs. In the past, lower commodity prices have driven down operating and capital costs, whereas the opposite has been true when commodity prices have risen.
Capital expenditures and operating costs
New or changing climate-related policy can impact our costs, demand for fossil fuels, the cost and availability of capital and exposure to litigation. The long-term impact on our financial performance, either positive or negative, will depend on several factors, including:
- Extent and timing of policy.
- Implementation details such as cap-and-trade or an emissions tax or fee system.
- Supply and demand-side renewable fuels or energy efficiency mandates.
- GHG reductions required.
- Level of carbon price.
- Price, availability and allowability of offsets.
- Amount and allocation of allowances.
- Technological and scientific developments leading to new products or services.
- Potential physical climate effects, such as increased severe weather events, changes in sea levels and changes in temperature.
- Extent to which increased compliance costs are reflected in the prices of our products and services.
The long-term financial impact from GHG regulations is impossible to predict accurately, but we expect the geographical reach of regulations and their associated costs to increase over time. We model such increases and test our portfolio in our long-term transition scenarios.
Our strategy is also made more robust by discipline in capital and average production costs per BOE. When oil prices fluctuate, we are able to respond with changes to short- and long-term planning, as well as more cost-effective and efficient operations.
Reputation and access to capital
In addition to considering cost of supply, portfolio resilience and cost of carbon, we also strive to compete more effectively by earning the confidence and trust of the communities in which we operate, as well as our equity and debt holders. We consider how our relative environmental, social and governance performance could affect our standing with investors and the financial sector, including banks and credit-rating agencies. An important priority in our corporate strategy has been remaining committed to our strong balance sheet that is resilient through commodity prices.
Financial position
Material information related to our financial position, including material climate-related matters, is disclosed in our most recently filed periodic report on Form 10-K and subsequent filings on Form 10-Q. Discussion of material climate-related factors includes, but is not limited to, the Risk Factors and Contingencies — Company Response to Climate-Related Risks sections.
Climate resilience
While our business operations are designed and operated to accommodate a range of potential climate conditions, significant changes, such as more frequent severe weather in the markets we serve or the areas where our assets are located, could cause increased expenses and impact to our operations. The costs associated with interrupted operations will depend on the duration and severity of any physical event and the damage and remedial work to be carried out. Financial implications could include business interruption, damage or loss of production uptime and delayed access to resources and markets. For example, a three-day shutdown of our Eagle Ford production would result in approximately 1170 MBOE of lost production and approximately $55 million in deferred revenue.2 It is unlikely all our Eagle Ford area production would be affected, as our operations are located across a wide span of the coast.
Business resiliency planning is a process that helps us prepare to mitigate potential physical risks of a changing climate in a cost-effective manner, supported by targeted, asset-specific measures that strengthen resilience across our portfolio. The examples below illustrate how this approach is applied in select locations and are not intended to represent all risks or mitigation strategies across our operations.
Canada
Wildfire Exposure
The Montney development team has made a concerted effort to situate pads within existing cut blocks where timber has already been cleared to minimize the risk from increased wildfire activity and minimize the risk of starting wildfires. For all high-risk activities (welding, grinding, etc.) during the fire season additional mitigations are implemented (water truck, fire watch, shovels, etc.) and verified on a daily basis. In response to increased wildfire activity in previous years, our Montney team completed a Fire Smart hazard assessment and implemented additional corrective actions to further reduce risks to critical infrastructure. At a landscape level, we completed an integrated land management plan at Surmont with a local forest company to strategically reduce forest fuel loading in areas of future infrastructure development.
An automated active wildfire early warning system continuously monitors the areas around both assets to identify active fires as a forewarning measure to keep people and infrastructure safe.
Precipitation and Flood Risk
In addition to mitigating fire risk, the Canada BU has addressed increased surface water flow from high-frequency and short-duration storm events in Surmont with increased onsite training for managing the movement of water from well pads and central processing facilities.
We have also implemented recommendations from an industry study on bioengineering techniques, such as live willow silt fences to mitigate erosion and sedimentation issues during intense rainfall events. This proactive surface water management is critical in preventing onsite erosion from damaging critical infrastructure. In the Montney region, we monitor streamflow at the Halfway River, which acts as a signal for potential upcoming low-flow conditions in winter, so appropriate mitigation measures can be enacted. Seasonal learnings like this inform streamflow prediction exercises and future development. We have also proactively assessed infrastructure design risks to account for a potential increase in high-frequency, short-duration storm events and are piloting the same bioengineering erosion and sediment control techniques used at Surmont.
Australia
The Australia BU conducts catchment-scale climate modeling to assess future water supply risks to the APLNG facility. The analysis indicates that, over the next 30 years, the local region may experience increased long-term evaporation combined with longer drought events. To mitigate this potential risk, both the Australia BU and the local water authority have investigated supplementary methods to provide water supply. We continue to review and update our risk assessments to plan for water availability and adapt our practices to a changing climate.
Alaska
Climate change is also considered during new project design. In 2020, our Alaska BU updated foundational design specification to increase the embedment depths for vertical support members and piles to align with predicted soil temperature trends. This revision updated the specification based on permafrost temperature trends and geothermal modeling predictions from 2020 through 2070. Use of the foundational design specification continues to date and will be revised as needed in the future.
1. Upstream Scope 3 emissions covered under the strategy include Category 1, purchased goods and services and Category 2, capital goods.
2. Based on 2025 Lower 48 Eagle Ford production and the 2025 average worldwide realized price of $47.01 per barrel of oil equivalent (BOE).