What we do
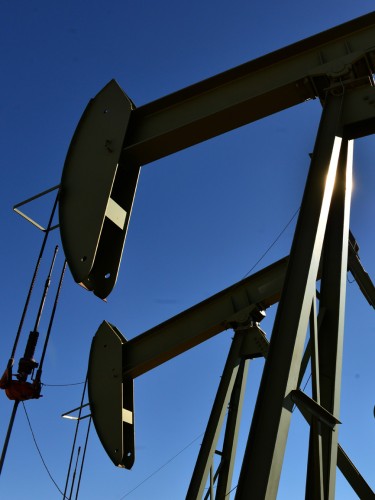
We produce oil and gas resources that power civilization.

We embrace our role in responsibly accessing, developing and producing oil and natural gas to help meet the world’s energy needs. We do this with a commitment to safe and responsible development that helps achieve economic growth, preserves and creates jobs, and ensures quality of life.
Exploration and production
We explore for, produce, transport and market crude oil, bitumen, natural gas, natural gas liquids and liquefied natural gas on a worldwide basis.
Innovation and technology
Revolutionizing our business, improving performance and enhancing the value of our assets.
Digitizing our business

Global Liquefied Natural Gas
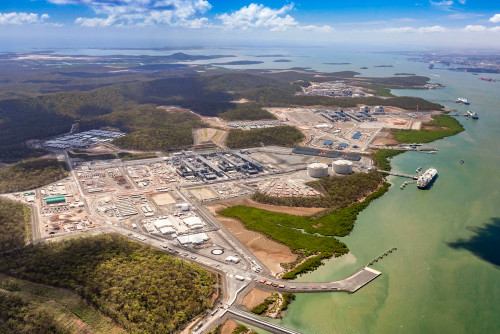
LNG Technology & Licensing

Global Water Sustainability Center


Commercial Gas & Power


-
Power in Cooperation
Together, we are working for responsible energy solutions.
